
The New QBR: Automating Business Reviews that Actually Drive Expansion Revenue
- Nina Wilkinson

- Jan 28
- 11 min read
For years, when I was a CSM, I dreaded Quarterly Business Reviews.
Not because I didn't care about my customers, I cared deeply. But because every QBR felt like I was drowning in spreadsheets at 11 PM the night before, frantically pulling together slides that would inevitably focus on... what already happened. Usage stats from Q2. Feature adoption from last month. A retrospective that my customer would politely sit through, even though they had all of this data on their dashboard, just not in shiny, pretty Google slides. Then they’d ask, "So what's next?"
And here's the kicker: I knew there was expansion revenue sitting right there in those accounts. New teams that could benefit from our platform. Adjacent use cases we could solve. But I was so buried in reporting that I never had time for the strategic conversation that actually drives growth.
Two weeks later, you realize that QBR generated exactly zero dollars in new revenue and, even worse, didn't actually improve the customer's health or happiness, and you have no clear action items for what to do next.
If this sounds familiar, you’re not alone. The traditional QBR is broken. For early-stage SaaS companies, it’s a time-consuming, low-ROI activity that frustrates your CSMs and bores your customers.
The biggest mistake we make? Treating the QBR as a report card. It’s a presentation at the customer, focused on what they’ve already done. Your customers don't care about a historical report; they care about their future. They care about solving their next big problem.
As a revenue leader, you know that your NRR is going to make or break your next funding round (or profitability goals). And you know that your post-sales motion needs to be more than just "keep them happy and hope they renew."
You need your QBRs to drive expansion revenue. Not someday. Now.
The good news? There's a better way. And it doesn't require hiring an army of CSMs or working weekends. It requires rethinking what a QBR actually is and leveraging automation to transform it from a backward-looking status report into a forward-looking revenue engine.
The Core Problem: Why Your Old QBR Playbook Fails
For companies in the $15−150k ARR range, every minute of your team's time is precious. The old QBR model is a resource vampire. If you’re a fan of What We Do in the Shadows, don’t be a Colin Robinson.

Let me paint you a picture you've probably seen a hundred times over.
Your CSM spends 4-6 hours preparing a 30-slide deck. It's got beautiful charts showing login frequency, feature adoption rates, support ticket trends, and maybe an NPS score. They present it to the customer. The customer nods along. Maybe they ask a question or two. The meeting ends with a vague "let's stay in touch" and everyone goes back to their day.
What just happened? You spent significant time and resources to tell your customer what they probably already knew—or worse, what they don't actually care about.
Here's what didn't happen:
You didn't uncover that their marketing team is struggling with the exact problem your second product solves
You didn't discover that they're planning a major initiative next quarter that could 3x their seat count
You didn't identify the early warning signs that their executive sponsor is about to leave
You didn't position yourself as a strategic partner—you positioned yourself as a vendor giving a report card
The three biggest mistakes I see with traditional QBRs:
Too backward-looking: Spending 80% of the time reviewing historical data instead of exploring future opportunities
Not enough value focus: Talking about your product metrics instead of their business outcomes
Too presentation-heavy: Death by Google Slides instead of collaborative conversation about what matters
And from the CSM side? CSMs are frustrated because:
The Prep is Painful: They spend 80% of their time manually gathering data and building slides, leaving only 20% for strategic thinking.
The Roadmap is Unclear: They don't know what to share, what to discuss, or how to guide the conversation toward a meaningful outcome.
The Impact is Murky: They leave the meeting unsure if they provided any real value, making it hard to justify the time spent.
This broken model doesn't just waste time; it actively kills your growth potential. Every QBR that doesn't identify an expansion opportunity is a missed chance to increase NRR, one of your single most important metrics for a healthy startup.
The New QBR Framework: From Status Report to Strategic Growth Plan
Here's the mindset shift that changes everything:
A QBR is not a report. It's a discovery session that happens to be informed by automated data.
When you stop thinking about QBRs as something you present to customers and start thinking about them as something you co-create with customers, everything changes. And automation is what makes this possible at scale.
Automation vs. Human Touch: The "Superpowered" CSM
Let’s clear up a common misconception. Automation isn’t here to replace your CSMs. It’s here to give them superpowers.
You didn’t hire smart, empathetic CSMs to copy and paste data into slides. You hired them to build relationships, understand customer goals, and provide consultative guidance.
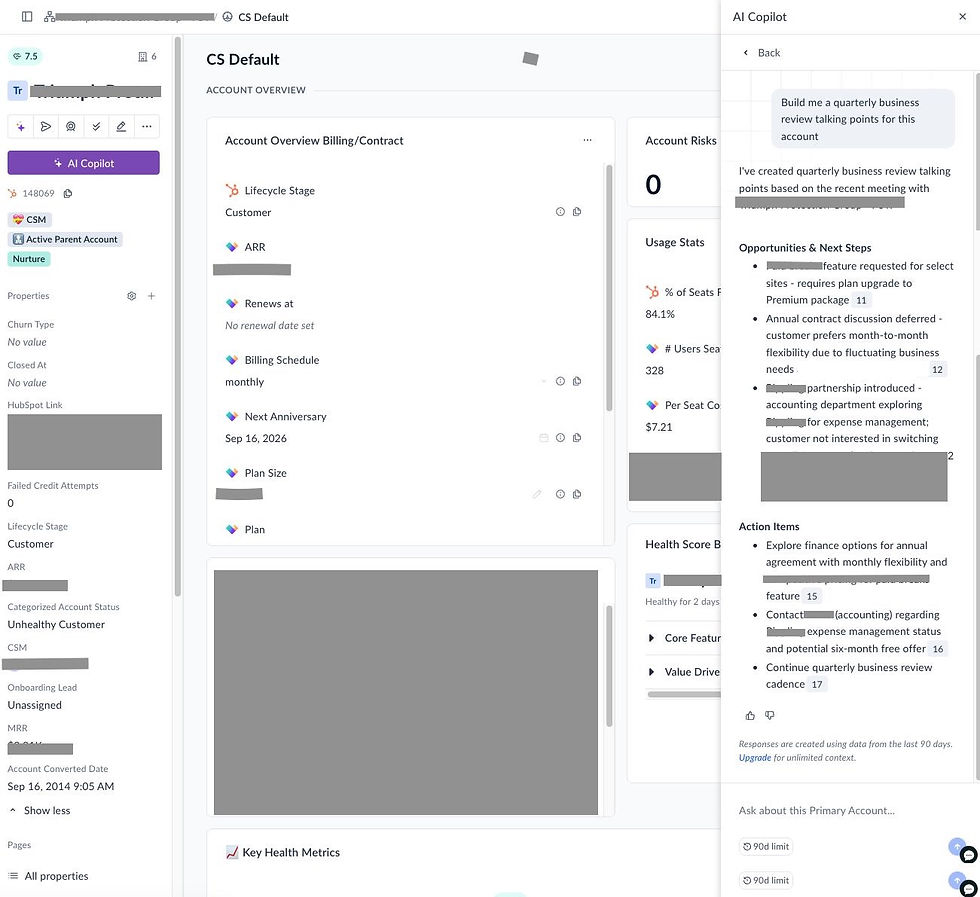
Automation is the tool that handles the grunt work. By using a Customer Success Platform (CSP) like Vitally and a recording tool like Granola, you can connect all your data sources—your product analytics, your CRM, your support desk—into a single, unified view.
Think about it this way. In the old model, your CSM spent:
60% of their time gathering data and building slides
30% of their time in reactive customer conversations
10% of their time on strategic thinking and expansion planning
With the right automation in place, that flips:
10% of their time reviewing auto-generated insights
20% of their time on relationship management and reactive support
70% of their time on strategic conversations and revenue-generating activities
So what does "automation" actually mean in this context?
At its core, you're automating three things:
Data aggregation and synthesis: Pulling together product usage, support interactions, sentiment signals, and health scores without manual work
Pattern recognition and insight generation: Identifying trends, risks, and opportunities that a human might miss in the noise
Workflow and preparation: Creating a structured framework so CSMs know exactly what to focus on for each customer
Tools like Vitally can automatically track customer health scores, compile usage analytics, surface lifecycle triggers, and their AI analysis can analyze sentiment and risk signals that don't show up in your product data. Granola can provide ongoing action items and next steps for both parties. Together, they give you a 360-degree view without the manual data wrangling.

But here's what automation can't do: have the nuanced conversation about why a customer's adoption stalled, or ask the right questions to uncover that they're about to launch a new team that needs your platform, or build the trusted relationship that makes a CFO comfortable expanding their investment with you.
That's the CSM's superpower. And automation gives them the time and insights to actually use it.
The Revenue-Focused QBR: A New Template

Alright, let's get physical tactical. Here's the framework I use for QBRs that actually drive expansion. This works particularly well for accounts in the $10-50K ACV range where you need to be efficient but still high-touch.
Firstly, let’s reframe the QBR internally and externally as a "Success Planning & Strategy Review." Again, this isn't a report; it's a working session about your customer’s business. The goal is to spend no more than 10% of the meeting looking back and 90% looking forward.
Here’s our new agenda and outline.
The New QBR Agenda (60 minutes)
Pre-meeting (Automated):
System generates customer health dashboard
CSM reviews automated insights and flags expansion opportunities
CSM prepares 2-3 specific discussion topics based on data
The Agenda (45 Minutes Total):
Part 1: The Look Back: Our Partnership Snapshot (5 mins)
This part is almost entirely automated. It's a quick, data-driven recap to set the stage.
Part 2: Value Realization: Aligning on Your ROI (15 mins)
This is the bridge. You connect their product usage to the actual business goals they shared during the sales process. These are not your product metrics.
Part 3: The Road Ahead: Your Next Big Opportunity (25 mins)
This is where the magic happens. It’s a collaborative brainstorming session focused on their future, which naturally uncovers expansion opportunities. Where are they going next quarter/year? What are their priorities? Are they releasing new products?
Ask about their hiring plans. I can’t tell you how many folks don’t know if their customers are hiring for the next 2 quarters! This is a fantastic opportunity to align with their hiring goals and tell them, “hey you’re hiring 6 new people next month, let me help you train them on the platform, I can take that off your plate”. Not only do you now know an upsell is coming your way, but you’re alleviating stress and burden from your customer. Win win!
Action Items & Next Steps. Be sure to document specific commitments from both sides
The Slide/Document Outline
Slide 1: Executive Summary & Strategic Goals
Headline: "Success Plan for [Customer Name]: Driving [Primary Business Goal]."
Key Achievements (Automated):
"X increase in team productivity since launch."
"Y hours saved per week using [Feature Z]."
Agenda: Briefly walk through the three parts of the meeting.
Slide 2: Value Realized: Hitting Your Original Goals
This slide is critical for reminding them why they bought your tool.
Goal 1 (From Sales Discovery): "Reduce new-hire onboarding time."
Our Data Shows: "Your team has adopted our 'Onboarding Templates' feature, and time-to-first-project for new users has decreased by 65, from 10 days to 3.5 days."
Goal 2 (From Sales Discovery): "Improve cross-functional visibility."
Our Data Shows: "Project dashboards are being viewed by users across 3 departments (Eng, Product, Marketing), up from just 1 department in Q3."
Slide 3: Health & Adoption Scorecard (Automated from your CSP)
This should be a visual, trend-based snapshot. Don't show a static number; show the trajectory.
License Utilization: "You have 50/50 licenses in use. Engagement is high among the Product team."
Feature Adoption: "Adoption of our core 'Project Management' module is at 90. However, the 'Advanced Reporting' module is only at 10."
Engagement Trend: Show a simple chart of weekly active users. Highlight key moments where it dipped or spiked.
Slide 4: The Opportunity Roadmap (The Expansion Engine)
This is a conversation starter, not a sales pitch. Frame it around their goals.
Observation: "From the data, we see your Product teams are living in the platform, but it looks like your Finance team hasn't been brought in yet. We also know a key company initiative for you this year is improving budget forecasting."
Expansion Play 1 (Upsell - Adding New Teams):
The Idea: "Many of our customers in your industry have found massive value by bringing their Finance teams into the platform to track project spending in real-time. This eliminates the need for manual spreadsheet updates your CFO mentioned."
The Question: "What would it look like if we ran a pilot to get your 5 Finance users access to our 'Advanced Reporting' module?"
Expansion Play 2 (Cross-Sell - New Product Line):
The Idea: "You mentioned that while project visibility is up, your team is now struggling to align those projects with high-level company OKRs. This is a challenge we're hearing from a lot of our customers."
The Question: "We've actually just launched our new 'Goals' module, designed specifically to solve that problem. Would it be helpful to map out how that could connect your day-to-day projects to your 2026 strategic plan?"
Slide 5: Joint Success Plan
This makes the conversation actionable. It's a simple table of "what we do" and "what you do."
Action Item | Owner | Due Date |
Send proposal for 5 Finance seats | [CSM Name] | Jan 16 |
Schedule 30-min demo of 'Goals' module for [Stakeholder] | [Customer Contact] | Jan 20 |
Deliver custom training for new hires | [CSM Name] | Feb 1 |
Example Metrics That Matter
Here are the key metrics I have our team reporting on in our QBRs:
Instead of: "You have 47 active users with an average of 12 logins per month"
Say: "Your sales team is using our platform to close deals 25% faster, which translated to 8 additional deals closed last quarter"
Instead of: "Feature adoption for Dashboard Builder is at 60%"
Say: "The teams using Dashboard Builder reported 50% reduction in manual reporting time—let's talk about getting your other teams this same benefit"
Instead of: "Your NPS score is 8"
Say: "Your VP of Sales told us last week that our platform 'changed how our team works'—let's make sure we're capturing all the ways we're driving value for your board reporting"
The pattern: Always tie product metrics to business outcomes. Revenue impact, time savings, efficiency gains, customer satisfaction, competitive advantage.
Expansion Plays for $$10-50K ACV Accounts
Here are the most common expansion motions and how to position them in your QBR:
Play 1: Team Expansion
Signal: High engagement from one team, low/no engagement from adjacent team
QBR Positioning: "Your Product team is seeing great results with [specific outcome]. I know your Marketing team has similar challenges around [related problem]. What if we got them set up next quarter?"
Expected Value: $$5-15K ARR
Play 2: Use Case Expansion
Signal: Customer is only using 1-2 core features, other features solve known pain points
QBR Positioning: "You mentioned wanting to streamline your reporting process. Our Advanced Analytics module was built specifically for this. Can I show you how [similar customer] saved 20 hours a month?"
Expected Value: $$3-10K ARR
Play 3: Cross-Sell to New Product Line
Signal: Customer expresses challenges that your other product solves; org changes indicating new needs
QBR Positioning: "When you mentioned your team is struggling with [problem], it made me think about our [Product B]. It's designed specifically for teams like yours who are already getting value from [Product A]. Would it make sense to explore how these work together?"
Expected Value: $$10-40K ARR
Play 4: Usage-Based Upgrade
Signal: Customer is approaching plan limits or showing consistently high usage
QBR Positioning: "You're clearly getting strong adoption—you're at 85% of your seat limit and usage has grown 40% this quarter. As you scale, our Pro tier might make more sense. It gives you [specific benefits] and better unit economics as you grow."
Expected Value: $$5-20K ARR
The key: Frame every expansion play around their goals and growth, not your quota. The QBR should surface these opportunities naturally through the "Future State Planning" discussion.
How to Automate Your QBR Prep (Without Losing the Personal Touch)
Here's my actual workflow for preparing revenue-focused QBRs efficiently:
7 Days Before QBR:
Automated health score report generated (Vitally)
Sentiment analysis from recent communications flagged (Vitally's AI has this and Sturdy is a newer tool in the market capturing this data)
Usage trends and feature adoption compiled automatically
CSM receives notification: "QBR prep ready for [Customer Name]"
3 Days Before QBR:
CSM spends 30-45 minutes reviewing automated insights
Identifies 2-3 discussion topics and 1-2 expansion opportunities
Pulls 1-2 success stories/metrics to highlight
Customizes slide template (not building from scratch)
1 Day Before QBR:
Send customer a brief pre-QBR survey (3-4 questions): What's changed? What are your goals for next quarter? Any challenges we should discuss?
This makes the meeting more collaborative and surfaces expansion opportunities before you even meet
During QBR:
Spend 10 minutes on slides, 50 minutes on conversation
Use slides as a framework, not a script
Take notes on expansion opportunities and timeline
After QBR:
Document expansion opportunities in CRM
Create automated follow-up tasks
Schedule next touchpoint
The automation handles the data grunt work. The human handles the strategic relationship work. That's the magic.
Making This Real: Getting Started This Quarter
Look, I know what you're thinking. "This sounds great, but I'm already stretched thin. How do I actually implement this?"
Start small. Here's what I'd do if I were in your shoes:
Week 1: Audit your last 5 QBRs. How much time was spent on backward-looking data vs. forward-looking strategy? How many expansion opportunities were identified? Be honest about what's working and what's not.
Week 2: Choose your automation stack. If you're already using a CS platform like Vitally, make sure you're leveraging automated health scores and reporting. If you're tracking sentiment manually, explore tools like Sturdy to surface conversation insights at scale.
Week 3: Build your QBR template using the framework above. Customize it for your product and customer base. The goal is to have a repeatable structure that your CSMs can personalize in 30-45 minutes, not 6-8 hours.
Week 4: Run 2-3 pilot QBRs with the new format. Get feedback from both your team and your customers. Iterate.
Week 5+: Roll out to your full customer base. Track metrics: time spent on prep, expansion opportunities identified, conversion rate on expansion plays, customer feedback on QBR format.
The QBR is dead. Long live the Success Planning & Strategy Review. By embracing automation to handle the reporting, you free up your team to do what they do best and what you actually hired them to do: build relationships, understand goals, and drive strategic value.
Stop wasting time on backward-looking reports and start co-creating the future with your customers. That’s how you build a world-class post-sales organization and turn CS into your most powerful engine for growth.


Comments